Market Outlook
May 11, 2017
Market Cues
Domestic Indices
Chg (%)
(Pts)
(Close)
Indian markets are likely to open positive tracking the SGX Nifty and Asian markets.
BSE Sensex
1.1
315
30,248
US stocks had another mixed trading session as traders wait for the release of
Nifty
1.0
90
9,407
economic data. The Labor Department released a report showing that import prices
Mid Cap
0.9
128
14,950
rose by 0.5 percent in April against an expectation of an increase of 0.2 percent.
Small Cap
0.8
117
15,662
Crude oil prices jumped $1.45 per barrel which helped energy stocks. The NYSE
Arca Oil Index climbed by 1.3 percent.
Bankex
0.4
108
25,940
UK stock indices continued their move up as energy prices moved higher. Insurer
Global Indices
Chg (%)
(Pts)
(Close)
Aviva rose 1.21 percent after announcing the sale of its shareholdings in its Spanish
life insurance and pension joint ventures. Barratt Developments jumped
2.26
Dow Jones
(0.2)
(33)
20,943
percent as the company announced that it expects pre-tax profit for the full year
Nasdaq
0.1
59
6,129
2017 to be at the top end of current analyst estimates.
FTSE
0.6
43
7,385
Indian markets hit new all-time highs on news of a possibility of better than average
Nikkei
(00.3
57
19,900
monsoon. The Oil & Gas and metal indices were the biggest gainers for the session
Hang Seng
0.5
126
25,015
and closed up by 0.83 and 0.86 percent respectively.
Shanghai Com
(0.9)
(28)
3,053
Result Preview
Advances / Declines
BSE
NSE
HCL Tech Q4FY17
Advances
1,624
1,025
News Analysis
Declines
1,245
634
Zydus Pharma wins’ patent battle for ulcerative colitis drug in US
Unchanged
168
89
Detailed analysis on Pg2
Volumes (` Cr)
Investor’s Ready Reckoner
BSE
3,625
Key Domestic & Global Indicators
NSE
24,298
Stock Watch: Latest investment recommendations on 150+ stocks
Refer Pg6 onwards
#Net Inflows (` Cr)
Net
Mtd
Ytd
Top Picks
FII
(5(581)
(1,396)
40,615
CMP
Target
Upside
Company
Sector
Rating
MFs
8229
2,401
23,083
(`)
(`)
(%)
Blue Star
Capital Goods
Accumulate
688
760
10.5
Dewan Housing Fin. Financials
Buy
442
520
17.8
Top Gainers
Price (`)
Chg (%)
Mahindra Lifespace Real Estate
Accumulate
467
522
11.9
Marksans
154
12.5
Navkar Corporation Others
Buy
215
265
23.3
Network18
51
8.9
KEI Industries
Capital Goods
Accumulate
235
239
1.9
More Top Picks on Pg4
Bhartiartl
373
7.9
Kec
237
7.2
Key Upcoming Events
Cgpower
89
6.3
Previous
Consensus
Date
Region
Event Description
Reading
Expectations
May 11, 2017 US
Initial Jobless claims
238.00
245.00
Top Losers
Price (`)
Chg (%)
May 11, 2017 UK
Industrial Production (YoY)
2.80
2.00
Denabank
242
(5.4)
May 11, 2017 US
Producer Price Index (mom)
(0.20)
Idbi
78
(4.8)
May 11, 2017 UK
BOE Announces rates
0.25
0.25
Biocon
1,004
(4.1)
May 12, 2017 India
Industrial Production YoY
(1.20)
2.00
May 12, 2017 India
Imports YoY%
45.30
Ceatltd
1,643
(3.5)
More Events on Pg5
Dishtv
92
(3.2)
#As on May 10, 2017
Market Outlook
May 11, 2017
Result Preview
HCL Tech (CMP: `619 / TP: `1,000 / Upside: 11.3%)
The company will post 4QFY2017 results today. In US $ the revenues are expected
to come in at US$1,810mn V/s US$1,745mn in 3QFY2017, a qoq growth of
3.7%. In rupee terms, the revenue is expected to grow by 2.1% qoq to `12,064cr
V/s `11,814cr in 3QFY2017. On the operating front, EBITDA margin is expected
to come in at 21.9% V/s 22.2% in 3QFY2017, a dip of 33ps qoq, while the EBIT is
expected to come in at 20.1% V/s 20.4% in 3QFY2017, 29bps qoq dip. Thus, PAT
is expected to come in at `1,982cr V/s `2,070cr in 3QFY2017, down 4.3% qoq.
Given the valuations, we maintain our buy rating with target price of `1,000.
Zydus Pharma wins’ patent battle for ulcerative colitis drug in US
The United States Court of Appeals for the Federal Circuit has affirmed the
judgment in favour of Zydus Pharmaceuticals, holding that its proposed generic
version of Lialda (mesalamine) did not infringe any US Patents.
This decision would allow the company to launch its generic drug in the US.
However, the company has not commented on when it plans to launch the drug.
Lialda is indicated for the induction of remission of active, mild to moderate
ulcerative colitis and for the maintenance of remission of ulcerative colitis.
Ulcerative colitis is a chronic inflammatory bowel disease that affects around
700,000 people in the US.
Zydus Pharma is a subsidiary of Cadila Healthcare.
Economic and Political News
UP govt targets `46,610cr in crop loan disbursal
India's cotton area rises 15% to 3-year high as prices rally
India to have 310 mn online gamers by 2021: KPMG
Corporate News
DLF to complete 3rd phase of IT- SEZ in Chennai, handover in Sept 2017
Tata Motors global sales decline 9% YoY in April from 81,333 units in April
2016 to 73,691 units in April 2017
CCI approves amalgamation of Dish TV and Videcon d2h
Infosys planning to further reduce headcount
RBI restricts IDBI Bank from borrowing over financial health concern
Market Outlook
May 11, 2017
Quarterly Bloomberg Brokers Consensus Estimate
Asian Paints Ltd Consol - May 11, 2017
Particulars ( ` cr)
4QFY17E
4QFY16
y-o-y (%)
3QFY17
q-o-q (%)
Net sales
4,249
3,919
8.4
3,889
9.3
EBITDA
749
704
6.4
776
(3.6)
EBITDA margin (%)
17.6
18.0
20.0
Net profit
474
409
16.0
466
1.7
HCL Technologies Ltd Consol - May 11, 2017
Particulars ( ` cr)
4QFY17E
4QFY16
y-o-y (%)
3QFY17
q-o-q (%)
Net sales
11,813
10,341
14.2
11,336
4.2
EBITDA
2,537
2,225
14.0
2,521
0.6
EBITDA margin (%)
21.5
21.5
22.2
Net profit
2,018
1925
4.8
2,055
(1.8)
Glenmark Pharmaceuticals Ltd Consol - May 11, 2017
Particulars ( ` cr)
4QFY17E
4QFY16
y-o-y (%)
3QFY17
q-o-q (%)
Net sales
2,903
2,289
26.8
2,463
17.9
EBITDA
989
302
227.9
765
29.3
EBITDA margin (%)
34.1
13.2
31.1
Net profit
588
171
242.9
477
23.3
Dr Reddy's Laboratories Ltd Consol - May 12, 2017
Particulars ( ` cr)
4QFY17E
4QFY16
y-o-y (%)
3QFY17
q-o-q (%)
Net sales
3,674
3,756
(2.2)
3,707
(0.9)
EBITDA
807
810
(0.4)
871
(7.4)
EBITDA margin (%)
22.0
21.6
23.5
Net profit
424
506
(16.2)
492
(14.0)
Nestle India Ltd - May 12, 2017
Particulars ( ` cr)
1QCY17E
1QCY16
y-o-y (%)
4QCY16
q-o-q (%)
Net sales
2,572
2,296
12.0
2,261
13.7
EBITDA
560
479
16.9
446
25.4
EBITDA margin (%)
21.8
20.9
19.7
Net profit
338
259
30.7
167
102.4
Titan Co Ltd - May 12, 2017
Particulars ( ` cr)
4QFY17E
4QFY16
y-o-y (%)
3QFY17
q-o-q (%)
Net sales
3,266
2,437
34.0
3,871
(15.6)
EBITDA
327
210
55.7
374
(12.4)
EBITDA margin (%)
10.0
8.6
9.6
Net profit
225
184
21.9
181
24.2
Market Outlook
May 11, 2017
Top Picks
Market Cap
CMP
Target
Upside
Company
Rationale
(` Cr)
(`)
(`)
(%)
Strong growth in domestic business due to its leadership
in acute therapeutic segment. Alkem expects to launch
Alkem Laboratories
22,793
1,906
2,257
18.4
more products in USA, which bodes for its international
business.
We expect the company would report strong profitability
Asian Granito
1,164
387
405
4.7
owing to better product mix, higher B2C sales and
amalgamation synergy..
Favourable outlook for the AC industry to augur well for
Cooling products business which is out pacing the market
Blue Star
6,572
688
760
10.5
growth. EMPPAC division's profitability to improve once
operating environment turns around..
With a focus on the low and medium income (LMI)
consumer segment, the company has increased its
Dewan Housing Finance
13,827
442
520
17.8
presence in tier-II & III cities where the growth opportunity
is immense.
Strong loan growth backed by diversified loan portfolio
and adequate CAR. ROE & ROA likely to remain decent
Equitas Holdings
5,572
165
235
42.5
as risk of dilution remains low. Attractive valuations
considering growth.
Economic recovery to have favourable impact on
advertising & circulation revenue growth. Further, the
Jagran Prakashan
6,396
196
225
15.0
acquisition of a radio business (Radio City) would also
boost the company's revenue growth.
High order book execution in EPC segment, rising B2C
KEI Industries
1,826
235
239
1.9
sales and higher exports to boost the revenues and
profitability
Speedier execution and speedier sales, strong revenue
Mahindra Lifespace
1,916
467
522
11.9
visibilty in short-to-long run, attractive valuations
Massive capacity expansion along with rail advantage at
Navkar Corporation
3,066
215
265
23.3
ICD as well CFS augurs well for the company
Strong brands and distribution network would boost
Siyaram Silk Mills
1,591
1,697
1,872
10.3
growth going ahead. Stock currently trades at an
inexpensive valuation.
Market leadership in Hindi news genre and no.
2
viewership ranking in English news genre, exit from the
TV Today Network
1,623
272
344
26.4
radio business, and anticipated growth in ad spends by
corporates to benefit the stock.
Source: Company, Angel Research
Market Outlook
May 11, 2017
Key Upcoming Events
Result Calendar
Date
Company
May 11, 2017
Asian Paints, GlaxoSmith Con, ITD Cementation, Vesuvius India, Nilkamal, Glenmark Pharma., MT Educare
May 12, 2017
UCO Bank, Relaxo, Dr Reddy's, GIPCL, S H Kelkar & Co., Quick Heal
May 13, 2017
Mangalam Cement, J & K Bank
May 15, 2017
JK Tyre, South Ind.Bank
Source: Bloomberg, Angel Research
Global economic events release calendar
Date
Time
Country
Event Description
Unit
Period
Bloomberg Data
Last Reported Estimated
May 11, 2017 6:00PM US
Initial Jobless claims
Thousands
May 6
238.00
245.00
2:00PM UK
Industrial Production (YoY)
% Change
Mar
2.80
2.00
US
Producer Price Index (mom)
% Change
Apr
(0.20)
--
4:30PM UK
BOE Announces rates
% Ratio
May 11
0.25
0.25
May 12, 2017 5:30PM India
Industrial Production YoY
% Change
Mar
(1.20)
2.00
India
Imports YoY%
% Change
Apr
45.30
--
India
Exports YoY%
% Change
Apr
27.60
--
6:00PM US
Consumer price index (mom)
% Change
Apr
(0.30)
0.20
11:30AM Germany
GDP nsa (YoY)
% Change
1Q P
1.20
2.80
5:00PM India
Monthly Wholesale Prices YoY%
% Change
Apr
5.70
4.59
May 15, 2017 7:30AM China
Industrial Production (YoY)
% Change
Apr
7.60
7.00
May 16, 2017 2:30PM Euro Zone
Euro-Zone GDP s.a. (QoQ)
% Change
1Q P
0.50
--
6:00PM US
Housing Starts
Thousands
Apr
1,215.00
1,250.00
6:00PM US
Building permits
Thousands
Apr
1,267.00
1,273.00
6:45PM US
Industrial Production
%
Apr
0.55
0.40
2:00PM UK
CPI (YoY)
% Change
Apr
2.30
--
May 17, 2017 2:00PM UK
Jobless claims change
% Change
Apr
25.50
--
2:30PM Euro Zone
Euro-Zone CPI (YoY)
%
Apr F
1.90
--
May 19, 2017 7:30PM Euro Zone
Euro-Zone Consumer Confidence
Value
May A
(3.60)
--
May 23, 2017 7:30PM US
New home sales
Thousands
Apr
621.00
620.00
May 24, 2017 1:00PM Germany
PMI Services
Value
May P
55.40
--
1:00PM Germany
PMI Manufacturing
Value
May P
58.20
--
7:30PM US
Existing home sales
Million
Apr
5.71
5.68
May 25, 2017 2:00PM UK
GDP (YoY)
% Change
1Q P
2.10
--
May 26, 2017 6:00PM US
GDP Qoq (Annualised)
% Change
1Q S
0.70
0.70
Source: Bloomberg, Angel Research
Market Outlook
May 11, 2017
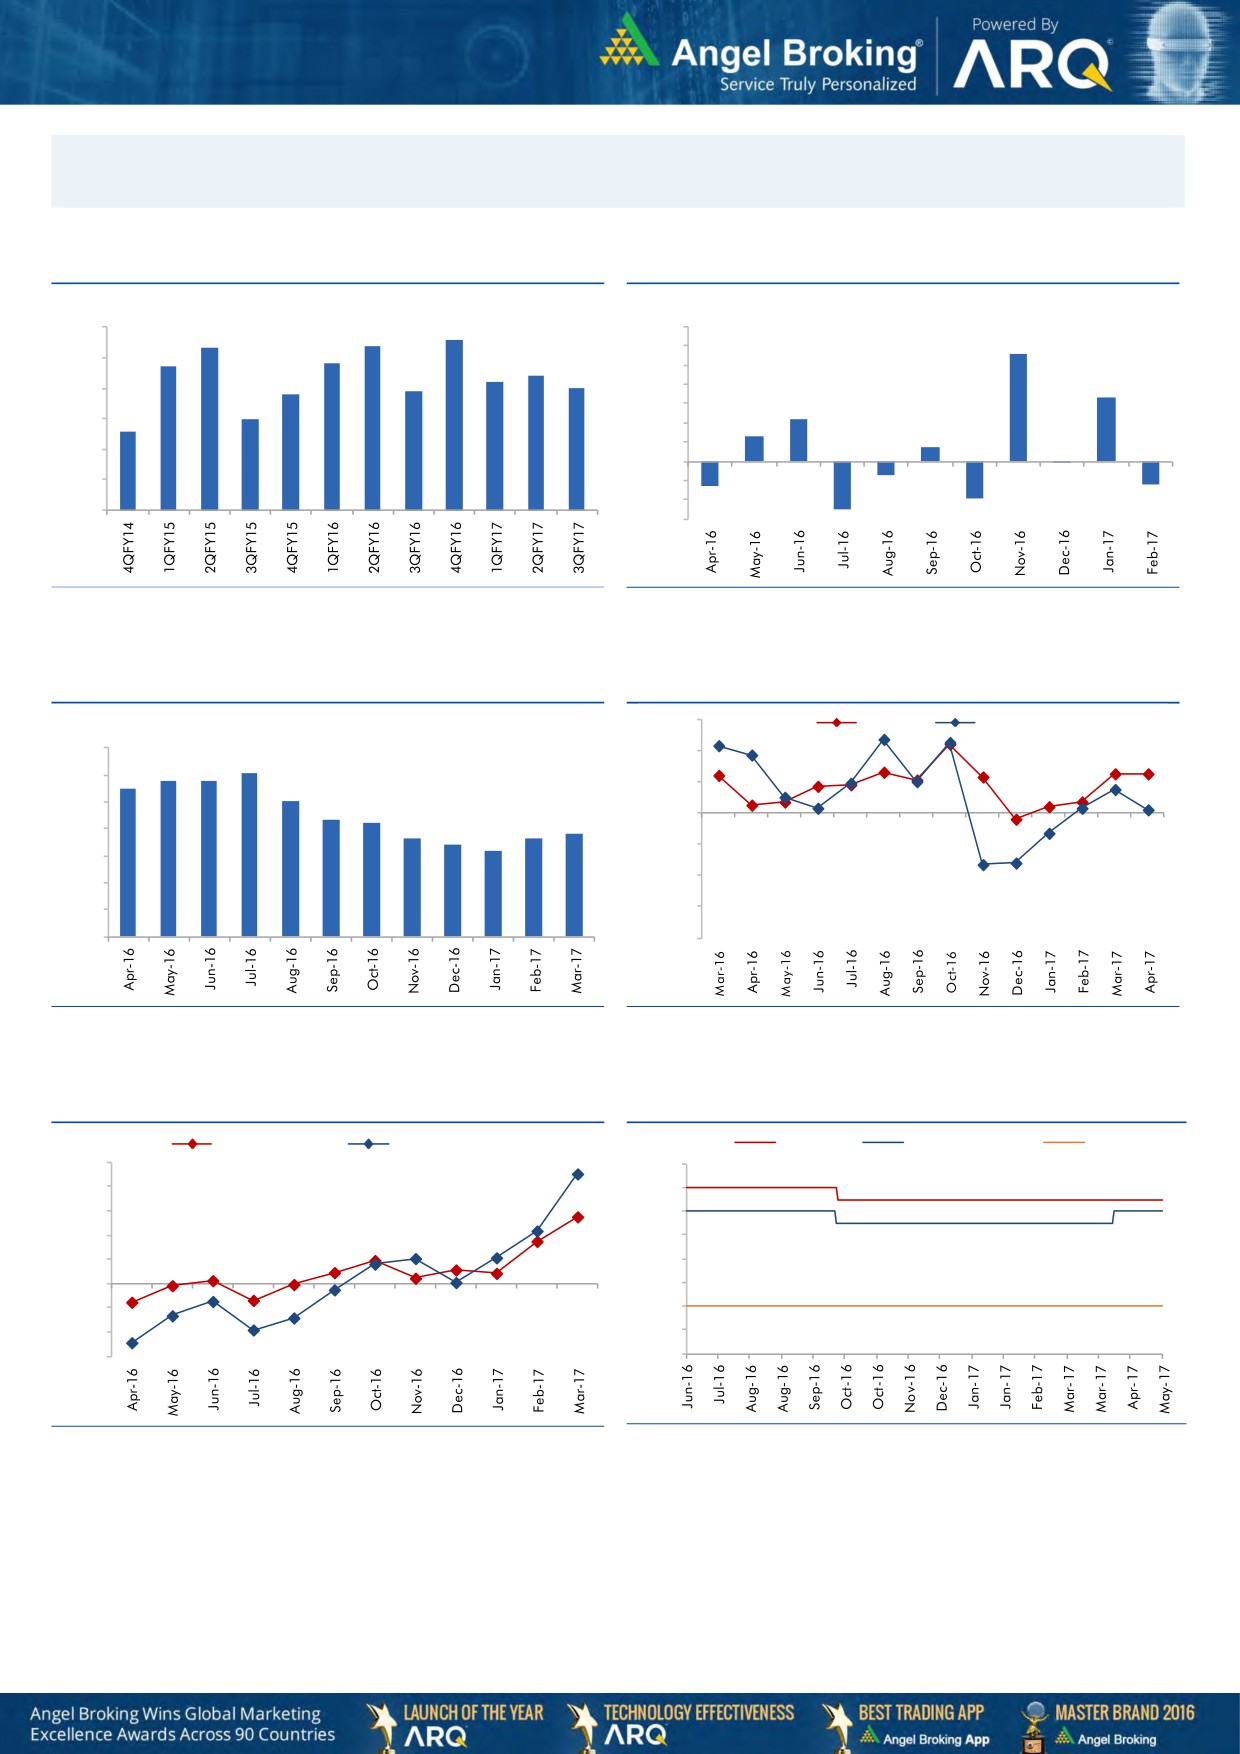
Macro watch
Exhibit 1: Quarterly GDP trends
Exhibit 2: IIP trends
(%)
(%)
8.6
9.0
8.3
8.4
7.0
5.6
7.7
7.8
6.0
8.0
7.4
7.2
5.0
6.9
7.0
6.8
4.0
3.3
7.0
6.0
3.0
2.2
6.0
5.6
1.3
2.0
0.7
1.0
5.0
-
4.0
(1.0)
(0.1)
(0.7)
(2.0)
(1.3)
(1.2)
3.0
(3.0)
(1.9)
(2.5)
Source: CSO, Angel Research
Source: MOSPI, Angel Research
Exhibit 3: Monthly CPI inflation trends
Exhibit 4: Manufacturing and services PMI
56.0
Mfg. PMI
Services PMI
(%)
7.0
54.0
6.1
5.8
5.8
6.0
5.5
5.1
52.0
5.0
4.3
4.2
3.8
50.0
3.6
3.7
4.0
3.4
3.2
48.0
3.0
46.0
2.0
1.0
44.0
-
42.0
Source: MOSPI, Angel Research
Source: Market, Angel Research; Note: Level above 50 indicates expansion
Exhibit 5: Exports and imports growth trends
Exhibit 6: Key policy rates
(%)
Exports yoy growth
Imports yoy growth
(%)
Repo rate
Reverse Repo rate
CRR
50.0
7.00
40.0
6.50
30.0
6.00
20.0
5.50
10.0
5.00
0.0
4.50
(10.0)
4.00
(20.0)
3.50
(30.0)
3.00
Source: Bloomberg, Angel Research
Source: RBI, Angel Research
Market Outlook
May 11, 2017
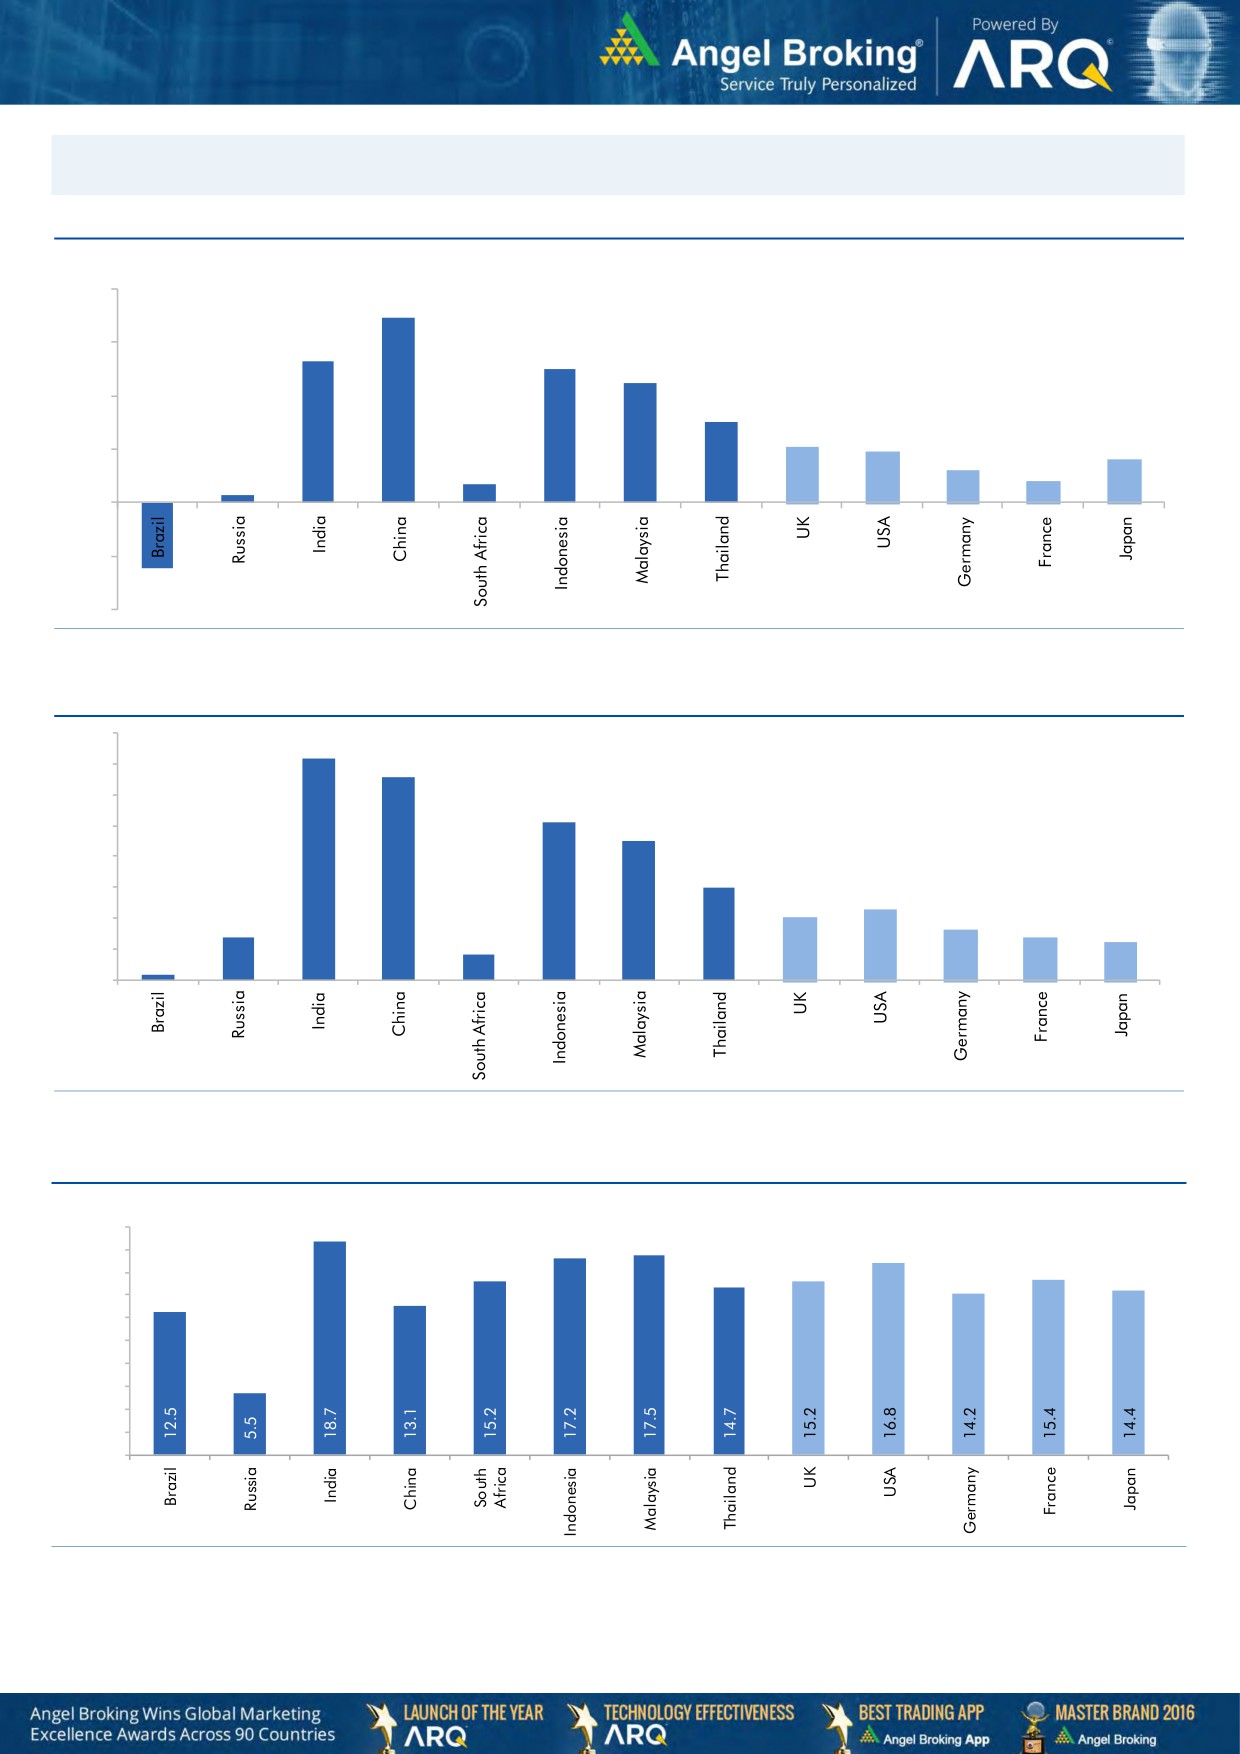
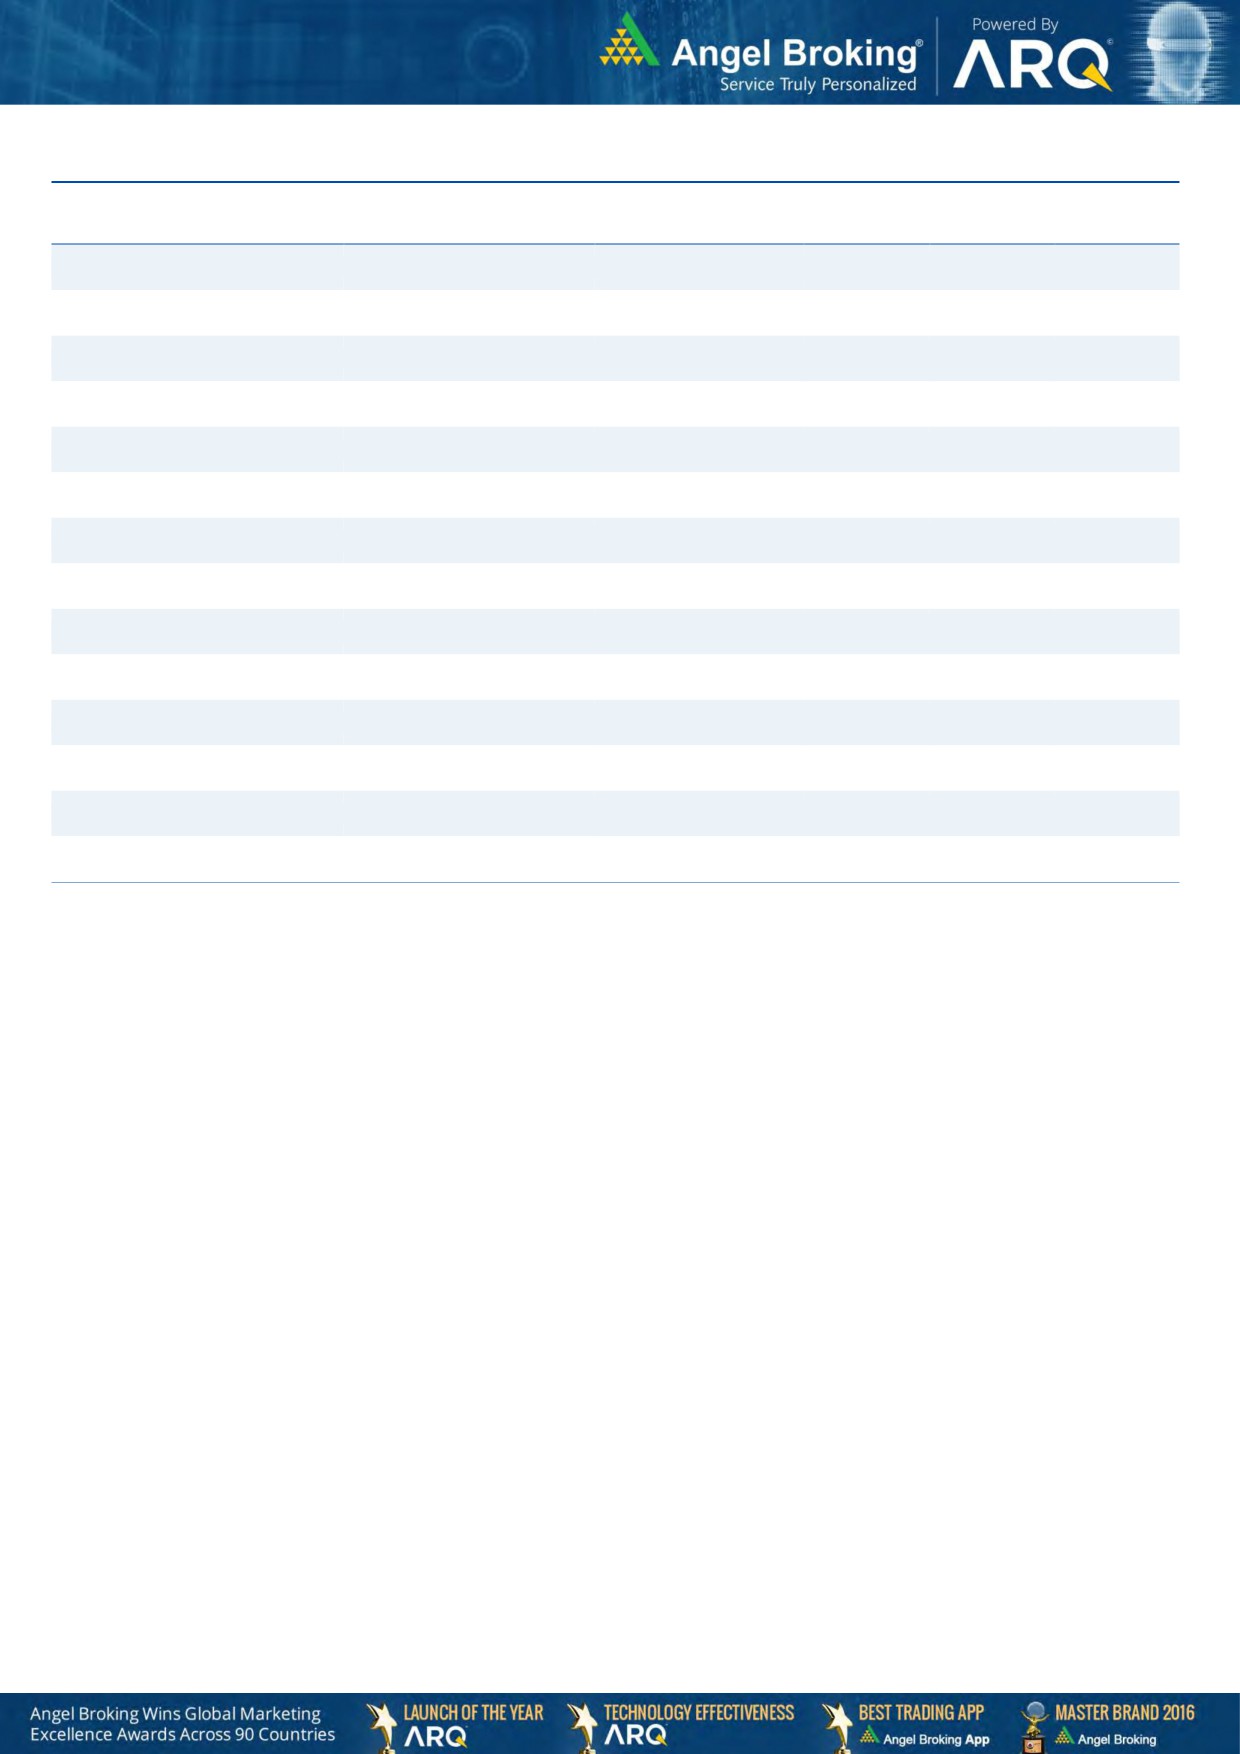
Global watch
Exhibit 1: Latest quarterly GDP Growth (%, yoy) across select developing and developed countries
(%)
8.0
6.9
6.0
5.3
5.0
0.7
4.5
4.0
3.0
2.1
1.9
0.3
1.6
2.0
1.2
0.8
-
(2.0)
(2.5)
(4.0)
Source: Bloomberg, Angel Research
Exhibit 2: 2016 GDP Growth projection by IMF (%, yoy) across select developing and developed countries
(%)
7.2
7.0
6.6
6.0
5.1
5.0
4.5
4.0
3.0
3.0
2.3
2.0
1.4
1.6
2.0
1.4
1.2
0.2
0.8
1.0
-
Source: IMF, Angel Research
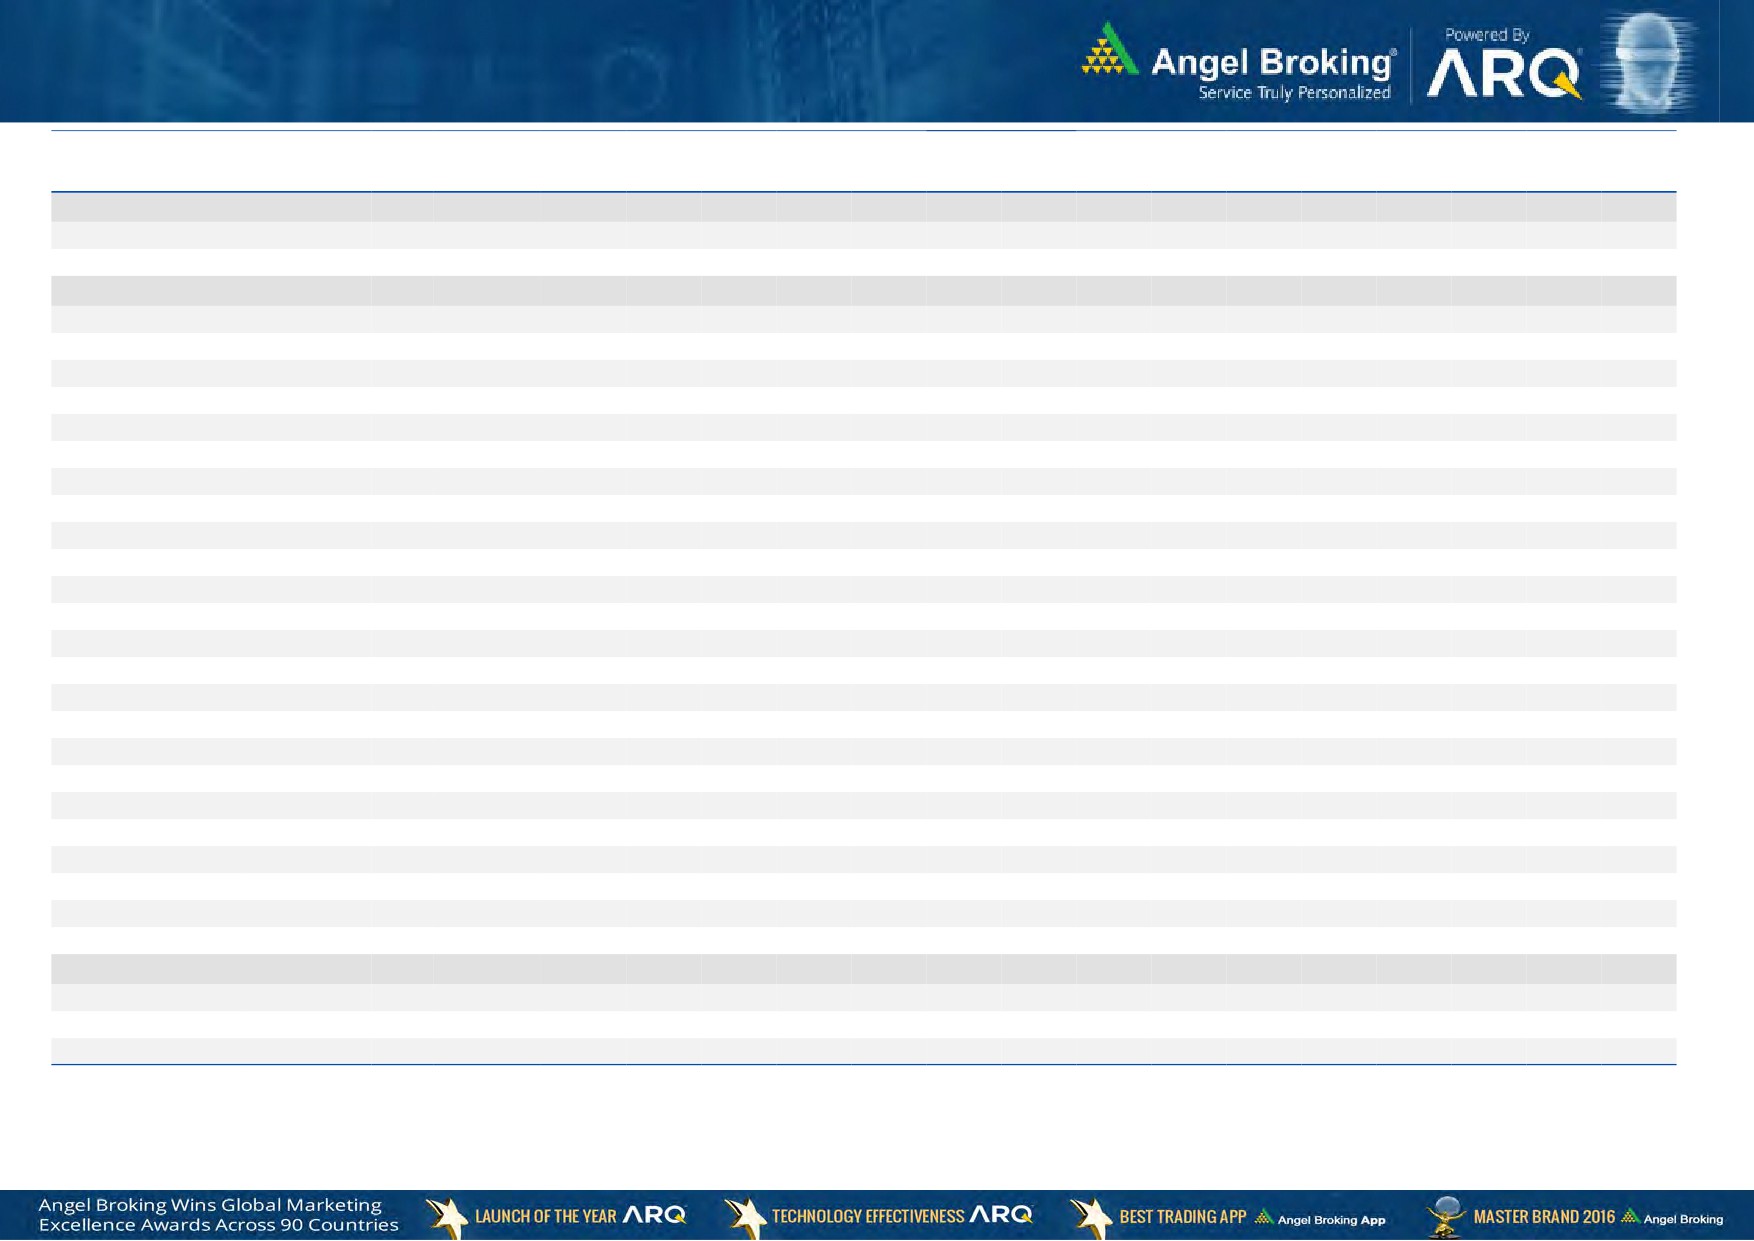
Exhibit 3: One year forward P-E ratio across select developing and developed countries
(x)
20.0
18.0
16.0
14.0
12.0
10.0
8.0
6.0
4.0
2.0
-
Source: IMF, Angel Research
Market Outlook
May 11, 2017
Exhibit 4: Relative performance of indices across globe
Returns (%)
Country
Name of index
Closing price
1M
3M
1YR
Brazil
Bovespa
67,350
4.0
4.3
30.2
Russia
Micex
2,028
(1.4)
(8.5)
6.6
India
Nifty
9,407
1.6
7.7
21.6
China
Shanghai Composite
3,053
(7.3)
(3.9)
2.9
South Africa
Top 40
47,636
4.1
3.9
5.6
Mexico
Mexbol
49,931
1.5
6.0
9.7
Indonesia
LQ45
942
0.1
6.3
12.9
Malaysia
KLCI
1,767
1.6
4.5
7.0
Thailand
SET 50
993
(0.6)
0.9
10.7
USA
Dow Jones
20,943
1.4
4.2
18.2
UK
FTSE
7,385
0.3
2.1
19.1
Japan
Nikkei
19,900
5.5
4.9
14.3
Germany
DAX
12,757
4.4
10.8
29.0
France
CAC
5,400
6.1
13.0
25.0
Source: Bloomberg, Angel Research
Stock Watch
May 11, 2017
Company Name
Reco
CMP
Target
Mkt Cap
Sales ( Čcr )
OPM(%)
EPS (Č)
PER(x)
P/BV(x)
RoE(%)
EV/Sales(x)
(Č)
Price ( Č)
( Č cr )
FY17E
FY18E
FY17E
FY18E
FY17E
FY18E
FY17E
FY18E
FY17E
FY18E
FY17E
FY18E
FY17E
FY18E
Agri / Agri Chemical
Rallis
Neutral
248
-
4,813
1,937
2,164
13.3
14.3
9.0
11.0
27.5
22.5
4.8
4.2
18.4
19.8
2.5
2.2
United Phosphorus
Neutral
824
-
41,839
15,176
17,604
18.5
18.5
37.4
44.6
22.0
18.5
4.3
3.6
21.4
21.2
2.9
2.4
Auto & Auto Ancillary
Amara Raja Batteries
Accumulate
898
1,009
15,334
5,305
6,100
16.0
16.3
28.4
34.0
31.6
26.4
6.1
5.1
19.3
19.3
2.9
2.5
Apollo Tyres
Neutral
231
-
11,769
12,877
14,504
14.3
13.9
21.4
23.0
10.8
10.1
1.7
1.5
16.4
15.2
1.1
1.0
Ashok Leyland
Buy
85
111
24,275
20,021
21,915
11.6
11.9
4.5
5.3
19.0
16.0
3.9
3.4
20.6
21.5
1.2
1.0
Bajaj Auto
Neutral
2,899
-
83,899
25,093
27,891
19.5
19.2
143.9
162.5
20.2
17.8
5.7
4.9
30.3
29.4
3.1
2.7
Bharat Forge
Neutral
1,124
-
26,172
7,726
8,713
20.5
21.2
35.3
42.7
31.9
26.3
5.9
5.3
18.9
20.1
3.5
3.0
Ceat
Neutral
1,643
-
6,647
7,524
8,624
13.0
12.7
131.1
144.3
12.5
11.4
2.3
2.0
19.8
18.6
1.0
0.8
Eicher Motors
Neutral
27,869
-
75,833
16,583
20,447
17.5
18.0
598.0
745.2
46.6
37.4
15.9
12.1
41.2
38.3
4.4
3.5
Exide Industries
Neutral
247
-
20,953
7,439
8,307
15.0
15.0
8.1
9.3
30.4
26.5
4.3
3.8
14.3
16.7
2.4
2.2
Gabriel India
Neutral
131
-
1,875
1,544
1,715
9.0
9.3
5.4
6.3
24.2
20.7
4.6
4.0
18.9
19.5
1.2
1.0
Hero Motocorp
Neutral
3,322
-
66,347
28,083
30,096
15.3
15.7
171.8
187.0
19.3
17.8
6.8
5.7
30.1
27.9
2.2
2.0
Indag Rubber
Neutral
212
-
557
286
326
19.8
16.8
11.7
13.3
18.2
15.9
3.1
2.9
17.8
17.1
1.6
1.4
Jamna Auto Industries
Neutral
242
-
1,929
1,486
1,620
9.8
9.9
15.0
17.2
16.1
14.1
3.5
3.0
21.8
21.3
1.4
1.2
JK Tyres
Neutral
176
-
3,996
7,455
8,056
15.0
15.0
21.8
24.5
8.1
7.2
1.7
1.4
22.8
21.3
0.7
0.6
L G Balakrishnan & Bros Neutral
660
-
1,036
1,302
1,432
11.6
11.9
43.7
53.0
15.1
12.5
2.1
1.9
13.8
14.2
0.9
0.8
Mahindra and Mahindra Neutral
1,377
-
85,506
46,534
53,077
11.6
11.7
67.3
78.1
20.5
17.6
3.3
2.9
15.4
15.8
1.8
1.6
Maruti
Neutral
6,731
-
203,321
67,822
83,288
16.0
16.4
253.8
312.4
26.5
21.6
6.1
4.9
23.0
22.9
2.7
2.1
Minda Industries
Neutral
497
-
4,298
2,728
3,042
9.0
9.1
68.2
86.2
7.3
5.8
1.7
1.3
23.8
24.3
1.6
1.4
Motherson Sumi
Neutral
409
-
57,364
45,896
53,687
7.8
8.3
13.0
16.1
31.3
25.4
10.1
8.1
34.7
35.4
1.3
1.1
Rane Brake Lining
Neutral
994
-
787
511
562
11.3
11.5
28.1
30.9
35.4
32.2
5.4
4.9
15.3
15.0
1.7
1.5
Setco Automotive
Neutral
41
-
551
741
837
13.0
13.0
15.2
17.0
2.7
2.4
0.4
0.4
15.8
16.3
1.1
1.0
Subros
Neutral
257
-
1,543
1,488
1,681
11.7
11.9
6.4
7.2
40.2
35.9
4.2
3.9
10.8
11.4
1.3
1.1
Swaraj Engines
Neutral
1,835
-
2,279
660
810
15.2
16.4
54.5
72.8
33.7
25.2
10.5
9.5
31.5
39.2
3.3
2.6
Tata Motors
Neutral
432
-
124,748
300,209
338,549
8.9
8.4
42.7
54.3
10.1
8.0
1.6
1.4
15.6
17.2
0.5
0.5
TVS Motor
Neutral
497
-
23,614
13,390
15,948
6.9
7.1
12.8
16.5
39.0
30.0
9.7
7.7
26.3
27.2
1.8
1.5
Capital Goods
ACE
Neutral
68
-
675
709
814
4.1
4.6
1.4
2.1
48.8
32.5
2.0
1.9
4.4
6.0
1.1
1.0
BEML
Neutral
1,360
-
5,663
3,451
4,055
6.3
9.2
31.4
57.9
43.3
23.5
2.6
2.4
6.3
10.9
1.8
1.5
BGR Energy
Neutral
183
-
1,319
16,567
33,848
6.0
5.6
7.8
5.9
23.4
31.0
1.3
1.3
4.7
4.2
0.2
0.1
Stock Watch
May 11, 2017
Company Name
Reco
CMP
Target
Mkt Cap
Sales ( Čcr )
OPM(%)
EPS (Č)
PER(x)
P/BV(x)
RoE(%)
EV/Sales(x)
(Č)
Price ( Č)
( Č cr )
FY17E
FY18E
FY17E
FY18E
FY17E
FY18E
FY17E
FY18E
FY17E
FY18E
FY17E
FY18E
FY17E
FY18E
Capital Goods
Bharat Electronics
Neutral
184
-
41,088
8,137
9,169
16.8
17.2
58.7
62.5
3.1
2.9
0.5
0.4
44.6
46.3
4.0
3.6
BHEL
Neutral
178
-
43,445
28,797
34,742
-
2.8
2.3
6.9
77.2
25.7
1.3
1.3
1.3
4.8
1.2
0.9
Blue Star
Accumulate
688
760
6,572
4,283
5,077
5.9
7.3
14.9
22.1
46.2
31.1
9.0
7.6
20.4
26.4
1.6
1.3
CG Power and Industrial
Neutral
89
-
5,572
5,777
6,120
5.9
7.0
3.3
4.5
26.9
19.8
1.2
1.1
4.4
5.9
0.9
0.8
Solutions
Greaves Cotton
Neutral
162
-
3,957
1,755
1,881
16.8
16.9
7.8
8.5
20.8
19.1
4.2
3.9
20.6
20.9
1.9
1.8
Inox Wind
Neutral
199
-
4,415
5,605
6,267
15.7
16.4
24.8
30.0
8.0
6.6
2.2
1.6
25.9
24.4
0.8
0.7
KEC International
Neutral
237
-
6,090
9,294
10,186
7.9
8.1
9.9
11.9
23.9
19.9
3.5
3.0
15.6
16.3
0.9
0.8
KEI Industries
Neutral
235
-
1,826
2,682
3,058
10.4
10.0
11.7
12.8
20.0
18.3
4.0
3.3
20.1
18.2
0.9
0.8
Thermax
Neutral
1,040
-
12,393
5,421
5,940
7.3
7.3
25.7
30.2
40.5
34.4
4.9
4.5
12.2
13.1
2.2
2.0
VATech Wabag
Neutral
675
-
3,684
3,136
3,845
8.9
9.1
26.0
35.9
26.0
18.8
3.3
2.8
13.4
15.9
1.1
0.9
Voltas
Neutral
440
-
14,572
6,511
7,514
7.9
8.7
12.9
16.3
34.1
27.0
6.1
5.4
16.7
18.5
2.0
1.7
Cement
ACC
Neutral
1,694
-
31,814
11,225
13,172
13.2
16.9
44.5
75.5
38.1
22.4
3.6
3.3
11.2
14.2
2.8
2.4
Ambuja Cements
Neutral
260
-
51,547
9,350
10,979
18.2
22.5
5.8
9.5
44.8
27.3
3.8
3.4
10.2
12.5
5.5
4.7
India Cements
Neutral
214
-
6,567
4,364
4,997
18.5
19.2
7.9
11.3
27.1
18.9
1.9
1.9
8.0
8.5
2.3
2.0
J K Lakshmi Cement
Neutral
510
-
6,004
2,913
3,412
14.5
19.5
7.5
22.5
68.0
22.7
4.2
3.5
12.5
18.0
2.6
2.2
JK Cement
Neutral
1,024
-
7,157
4,398
5,173
15.5
17.5
31.2
55.5
32.8
18.5
3.9
3.4
12.0
15.5
2.2
1.8
Orient Cement
Neutral
165
-
3,375
2,114
2,558
18.5
20.5
8.1
11.3
20.3
14.6
3.0
2.5
9.0
14.0
2.2
1.7
UltraTech Cement
Neutral
4,366
-
119,841
25,768
30,385
21.0
23.5
111.0
160.0
39.3
27.3
5.0
4.4
13.5
15.8
4.7
4.0
Construction
Engineers India
Neutral
168
-
11,331
1,725
1,935
16.0
19.1
11.4
13.9
14.8
12.1
2.0
2.0
13.4
15.3
5.5
4.9
Gujarat Pipavav Port
Neutral
161
-
7,766
705
788
52.2
51.7
5.0
5.6
32.1
28.7
3.2
2.8
11.2
11.2
10.7
9.1
ITNL
Neutral
116
-
3,821
8,946
10,017
31.0
31.6
8.1
9.1
14.3
12.8
0.5
0.5
4.2
5.0
3.8
3.5
KNR Constructions
Neutral
207
-
2,914
1,385
1,673
14.7
14.0
41.2
48.5
5.0
4.3
0.9
0.8
14.9
15.2
2.2
1.8
Larsen & Toubro
Neutral
1,740
-
162,417
111,017
124,908
11.0
11.0
61.1
66.7
28.5
26.1
3.4
3.2
13.1
12.9
2.5
2.3
MEP Infra
Neutral
71
-
1,146
1,877
1,943
30.6
29.8
3.0
4.2
23.5
16.8
11.4
7.7
0.6
0.6
2.0
1.8
Nagarjuna Const.
Neutral
95
-
5,304
8,842
9,775
9.1
8.8
5.3
6.4
18.0
14.9
1.4
1.3
8.2
9.1
0.8
0.7
NBCC
Neutral
198
-
17,825
7,428
9,549
7.9
8.6
8.2
11.0
24.2
18.0
1.2
1.0
28.2
28.7
2.1
1.6
PNC Infratech
Neutral
161
-
4,135
2,350
2,904
13.1
13.2
9.0
8.8
17.9
18.3
0.7
0.6
15.9
13.9
1.9
1.5
Power Mech Projects
Neutral
609
-
896
1,801
2,219
12.7
14.6
72.1
113.9
8.5
5.4
1.6
1.3
16.8
11.9
0.5
0.4
Sadbhav Engineering
Neutral
340
-
5,835
3,598
4,140
10.3
10.6
9.0
11.9
37.8
28.6
4.0
3.5
9.9
11.9
1.9
1.6
Stock Watch
May 11, 2017
Company Name
Reco
CMP
Target
Mkt Cap
Sales ( Čcr )
OPM(%)
EPS (Č)
PER(x)
P/BV(x)
RoE(%)
EV/Sales(x)
(Č)
Price ( Č)
( Č cr )
FY17E
FY18E
FY17E
FY18E
FY17E
FY18E
FY17E
FY18E
FY17E
FY18E
FY17E
FY18E
FY17E
FY18E
Construction
Simplex Infra
Neutral
408
-
2,016
6,829
7,954
10.5
10.5
31.4
37.4
13.0
10.9
1.4
1.2
9.9
13.4
0.7
0.6
SIPL
Neutral
107
-
3,765
1,036
1,252
65.5
66.2
(8.4)
(5.6)
4.0
4.6
(22.8)
(15.9)
11.9
9.9
Financials
Axis Bank
Accumulate
526
580
126,048
46,932
53,575
3.5
3.4
32.4
44.6
16.3
11.8
2.1
1.8
13.6
16.5
-
-
Bank of Baroda
Neutral
186
-
42,811
19,980
23,178
1.8
1.8
11.5
17.3
16.2
10.7
1.9
1.5
8.3
10.1
-
-
Can Fin Homes
Neutral
2,805
-
7,467
420
526
3.5
3.5
86.5
107.8
32.4
26.0
7.0
5.7
23.6
24.1
-
-
Canara Bank
Neutral
368
-
22,004
15,225
16,836
1.8
1.8
14.5
28.0
25.4
13.2
1.8
1.4
5.8
8.5
-
-
Cholamandalam Inv. &
Accumulate
1,088
1,230
17,002
2,012
2,317
6.3
6.3
42.7
53.6
25.5
20.3
4.0
3.5
16.9
18.3
-
-
Fin. Co.
Dewan Housing Finance Buy
442
520
13,827
2,225
2,688
2.9
2.9
29.7
34.6
14.9
12.8
2.4
1.6
16.1
14.8
-
-
Equitas Holdings
Buy
165
235
5,572
939
1,281
11.7
11.5
5.8
8.2
28.4
20.1
2.5
2.2
10.9
11.5
-
-
Federal Bank
Accumulate
117
125
20,183
8,259
8,995
3.0
3.0
4.3
5.6
27.2
20.9
2.3
2.1
8.5
10.1
-
-
HDFC
Neutral
1,573
-
249,865
11,475
13,450
3.4
3.4
45.3
52.5
34.7
30.0
6.7
5.9
20.2
20.5
-
-
HDFC Bank
Accumulate
1,551
1,650
397,830
46,097
55,433
4.5
4.5
58.4
68.0
26.6
22.8
4.7
3.9
18.8
18.6
-
-
ICICI Bank
Accumulate
299
315
173,923
42,800
44,686
3.1
3.3
18.0
21.9
16.6
13.6
2.3
2.1
11.1
12.3
-
-
Karur Vysya Bank
Buy
119
140
7,209
5,640
6,030
3.3
3.2
8.9
10.0
13.4
11.9
1.4
1.3
11.2
11.4
-
-
Lakshmi Vilas Bank
Neutral
181
-
3,459
3,339
3,799
2.7
2.8
11.0
14.0
16.4
12.9
1.7
1.6
11.2
12.7
-
-
LIC Housing Finance
Neutral
697
-
35,188
3,712
4,293
2.6
2.5
39.0
46.0
17.9
15.2
3.4
2.9
19.9
20.1
-
-
Punjab Natl.Bank
Neutral
172
-
36,612
23,532
23,595
2.3
2.4
6.8
12.6
25.3
13.7
3.9
2.8
3.3
6.5
-
-
RBL Bank
Neutral
562
-
21,086
1,783
2,309
2.6
2.6
12.7
16.4
44.3
34.3
4.8
4.3
12.8
13.3
-
-
Repco Home Finance
Accumulate
759
825
4,748
388
457
4.5
4.2
30.0
38.0
25.3
20.0
4.2
3.5
18.0
19.2
-
-
South Ind.Bank
Neutral
26
-
4,714
6,435
7,578
2.5
2.5
2.7
3.1
9.7
8.4
1.3
1.1
10.1
11.2
-
-
St Bk of India
Neutral
295
-
238,916
88,650
98,335
2.6
2.6
13.5
18.8
21.8
15.7
2.1
1.8
7.0
8.5
-
-
Union Bank
Neutral
177
-
12,147
13,450
14,925
2.3
2.3
25.5
34.5
6.9
5.1
1.0
0.9
7.5
10.2
-
-
Yes Bank
Neutral
1,599
-
73,017
8,978
11,281
3.3
3.4
74.0
90.0
21.6
17.8
4.1
3.5
17.0
17.2
-
-
FMCG
Akzo Nobel India
Neutral
1,950
-
9,353
2,955
3,309
13.3
13.7
57.2
69.3
34.1
28.1
11.1
9.4
32.7
33.3
3.0
2.6
Asian Paints
Neutral
1,158
-
111,042
17,128
18,978
16.8
16.4
19.1
20.7
60.6
55.9
21.1
19.9
34.8
35.5
6.4
5.8
Britannia
Neutral
3,713
-
44,555
9,594
11,011
14.6
14.9
80.3
94.0
46.2
39.5
19.0
14.7
41.2
-
4.5
3.9
Colgate
Neutral
1,019
-
27,728
4,605
5,149
23.4
23.4
23.8
26.9
42.8
37.9
23.7
18.5
64.8
66.8
5.9
5.3
Dabur India
Accumulate
282
304
49,710
8,315
9,405
19.8
20.7
8.1
9.2
34.8
30.7
9.7
8.0
31.6
31.0
5.6
4.9
GlaxoSmith Con*
Neutral
5,354
-
22,517
4,350
4,823
21.2
21.4
179.2
196.5
29.9
27.3
7.9
6.7
27.1
26.8
4.6
4.0
Stock Watch
May 11, 2017
Company Name
Reco
CMP
Target
Mkt Cap
Sales ( Čcr )
OPM(%)
EPS (Č)
PER(x)
P/BV(x)
RoE(%)
EV/Sales(x)
(Č)
Price ( Č)
( Č cr )
FY17E FY18E
FY17E
FY18E
FY17E
FY18E
FY17E
FY18E
FY17E
FY18E
FY17E
FY18E
FY17E
FY18E
FMCG
Godrej Consumer
Neutral
1,925
-
65,559
10,235
11,428
18.4
18.6
41.1
44.2
46.8
43.6
10.4
8.8
24.9
24.8
6.5
5.7
HUL
Neutral
996
-
215,548
35,252
38,495
17.8
17.8
20.7
22.4
48.2
44.5
46.1
39.5
95.6
88.9
6.0
5.4
ITC
Neutral
274
-
332,717
40,059
44,439
38.3
39.2
9.0
10.1
30.5
27.0
8.5
7.4
27.8
27.5
7.8
7.0
Marico
Neutral
316
-
40,714
6,430
7,349
18.8
19.5
6.4
7.7
49.3
41.0
14.9
12.5
33.2
32.5
6.1
5.3
Nestle*
Neutral
6,919
-
66,711
10,073
11,807
20.7
21.5
124.8
154.2
55.4
44.9
22.8
20.5
34.8
36.7
6.4
5.5
Procter & Gamble
Neutral
7,913
-
25,687
2,939
3,342
23.2
23.0
146.2
163.7
54.1
48.3
13.7
11.4
25.3
23.5
8.3
7.2
Hygiene
Tata Global
Neutral
155
-
9,773
8,675
9,088
9.8
9.8
7.4
8.2
20.9
18.9
1.7
1.6
7.9
8.1
1.0
1.0
IT
HCL Tech^
Buy
842
1,000
120,209
49,242
57,168
20.5
20.5
55.7
64.1
15.1
13.1
3.1
2.4
20.3
17.9
2.3
1.9
Infosys
Buy
943
1,179
216,648
68,484
73,963
26.0
26.0
63.0
64.0
15.0
14.7
3.1
2.9
20.8
19.7
2.8
2.5
TCS
Accumulate
2,333
2,651
459,602
117,966
127,403
27.5
27.6
134.3
144.5
17.4
16.1
5.2
4.8
29.8
29.7
3.5
3.3
Tech Mahindra
Buy
430
600
41,913
29,673
32,937
15.5
17.0
32.8
39.9
13.1
10.8
2.6
2.2
19.6
20.7
1.2
1.0
Wipro
Accumulate
500
570
121,697
55,421
58,536
20.3
20.3
35.1
36.5
14.3
13.7
2.5
2.1
19.2
14.6
1.6
1.4
Media
D B Corp
Neutral
374
-
6,875
2,297
2,590
27.4
28.2
21.0
23.4
17.8
16.0
4.2
3.6
23.7
23.1
2.8
2.4
Hindustan Media
Neutral
284
-
2,083
1,016
1,138
24.3
25.2
27.3
30.1
10.4
9.4
2.0
1.8
16.2
15.8
1.4
1.2
Ventures
HT Media
Neutral
84
-
1,963
2,693
2,991
12.6
12.9
7.9
9.0
10.7
9.4
0.9
0.8
7.8
8.3
0.3
0.2
Jagran Prakashan
Accumulate
196
225
6,396
2,355
2,635
28.0
28.0
10.8
12.5
18.1
15.7
3.9
3.4
21.7
21.7
2.7
2.4
Sun TV Network
Neutral
862
-
33,980
2,850
3,265
70.1
71.0
26.2
30.4
32.9
28.4
8.4
7.4
24.3
25.6
11.5
9.9
TV Today Network
Buy
272
344
1,623
567
645
26.7
27.0
15.4
18.1
17.7
15.0
2.6
2.3
14.9
15.2
2.4
2.0
Metals & Mining
Coal India
Neutral
278
-
172,752
84,638
94,297
21.4
22.3
24.5
27.1
11.4
10.3
4.7
4.5
42.6
46.0
1.6
1.4
Hind. Zinc
Neutral
255
-
107,851
14,252
18,465
55.9
48.3
15.8
21.5
16.2
11.9
2.6
2.3
17.0
20.7
7.6
5.8
Hindalco
Neutral
187
-
41,972
107,899
112,095
7.4
8.2
9.2
13.0
20.3
14.4
1.0
0.9
4.8
6.6
0.9
0.8
JSW Steel
Neutral
197
-
47,728
53,201
58,779
16.1
16.2
130.6
153.7
1.5
1.3
0.2
0.2
14.0
14.4
1.7
1.4
NMDC
Neutral
126
-
39,849
6,643
7,284
44.4
47.7
7.1
7.7
17.7
16.4
1.5
1.5
8.8
9.2
3.8
3.4
SAIL
Neutral
61
-
25,235
47,528
53,738
(0.7)
2.1
(1.9)
2.6
23.5
0.7
0.6
(1.6)
3.9
1.4
1.3
Tata Steel
Neutral
438
-
42,530
121,374
121,856
7.2
8.4
18.6
34.3
23.5
12.8
1.5
1.3
6.1
10.1
1.0
1.0
Vedanta
Neutral
229
-
67,773
71,744
81,944
19.2
21.7
13.4
20.1
17.1
11.4
1.5
1.3
8.4
11.3
1.3
1.0
Oil & Gas
Cairn India
#VALUE!
9,127
10,632
4.3
20.6
8.8
11.7
3.3
4.2
GAIL
Neutral
418
-
70,637
56,220
65,198
9.3
10.1
27.1
33.3
15.4
12.5
1.4
1.3
9.3
10.7
1.4
1.2
Indian Oil Corp
Neutral
441
-
214,364
373,359
428,656
5.9
5.5
54.0
59.3
8.2
7.4
1.3
1.1
16.0
15.6
0.7
0.6
Stock Watch
May 11, 2017
Company Name
Reco
CMP
Target
Mkt Cap
Sales ( Čcr )
OPM(%)
EPS (Č)
PER(x)
P/BV(x)
RoE(%)
EV/Sales(x)
(Č)
Price ( Č)
( Č cr )
FY17E FY18E
FY17E
FY18E
FY17E
FY18E
FY17E
FY18E
FY17E
FY18E
FY17E
FY18E
FY17E
FY18E
Oil & Gas
ONGC
Neutral
188
-
241,072
137,222
152,563
15.0
21.8
19.5
24.1
9.6
7.8
0.8
0.8
8.5
10.1
2.0
1.8
Reliance Industries
Neutral
1,360
-
442,019
301,963
358,039
12.1
12.6
87.7
101.7
15.5
13.4
1.6
1.4
10.7
11.3
1.9
1.6
Pharmaceuticals
Alembic Pharma
Accumulate
600
648
11,312
3,101
3,966
19.7
20.5
21.4
25.5
28.0
23.5
6.0
4.9
23.0
22.8
3.6
2.7
Alkem Laboratories Ltd
Buy
1,906
2,257
22,793
6,065
7,009
18.7
20.0
80.2
92.0
23.8
20.7
5.3
4.5
22.5
21.6
3.7
3.2
Aurobindo Pharma
Buy
619
877
36,263
15,720
18,078
23.7
23.7
41.4
47.3
15.0
13.1
3.9
3.0
29.6
26.1
2.5
2.2
Aventis*
Neutral
4,221
-
9,721
2,206
2,508
16.6
16.8
128.9
139.9
32.8
30.2
5.6
4.4
21.6
23.5
4.2
3.5
Cadila Healthcare
Neutral
470
-
48,121
10,429
12,318
17.7
21.6
13.1
19.2
35.9
24.5
7.5
6.0
22.8
27.1
4.7
3.8
Cipla
Sell
560
465
45,032
15,378
18,089
15.7
16.8
19.3
24.5
29.0
22.9
3.4
3.0
12.3
13.9
3.1
2.6
Dishman Pharma
Sell
310
143
5,010
1,718
1,890
22.7
22.8
9.5
11.3
32.7
27.5
3.2
2.9
10.1
10.9
3.4
3.0
Dr Reddy's
Neutral
2,600
-
43,077
16,043
18,119
18.0
23.0
78.6
130.9
33.1
19.9
3.2
2.8
10.1
15.2
2.5
2.4
GSK Pharma*
Neutral
2,422
-
20,517
2,800
3,290
10.2
20.6
32.2
60.3
75.2
40.2
13.9
13.8
17.2
34.5
7.1
6.1
Indoco Remedies
Accumulate
228
240
2,104
1,112
1,289
16.2
18.2
11.6
16.0
19.7
14.3
3.1
2.6
17.0
20.1
2.0
1.7
Ipca labs
Accumulate
549
613
6,929
3,258
3,747
12.8
15.3
12.1
19.2
45.4
28.6
2.8
2.6
6.4
9.5
2.3
2.0
Lupin
Buy
1,260
1,809
56,890
15,912
18,644
26.4
26.7
58.1
69.3
21.7
18.2
4.2
3.5
21.4
20.9
3.7
3.0
Natco Pharma
Accumulate
898
974
15,649
2,090
2,335
32.1
26.6
26.8
23.2
33.5
38.7
9.5
8.2
28.4
21.1
7.6
92.7
Sun Pharma
Buy
642
847
154,115
31,129
35,258
32.0
32.9
30.2
35.3
21.3
18.2
3.5
2.9
20.0
20.1
4.5
3.8
Power
NTPC
Neutral
162
-
133,783
86,605
95,545
17.5
20.8
11.8
13.4
13.8
12.1
1.4
1.3
10.5
11.1
2.9
2.9
Power Grid
Accumulate
211
223
110,125
25,315
29,193
88.2
88.7
14.2
17.2
14.9
12.3
2.3
2.0
15.2
16.1
9.0
8.1
Tata Power
Neutral
82
-
22,098
36,916
39,557
17.4
27.1
5.1
6.3
16.0
13.0
1.4
1.3
9.0
10.3
1.6
1.5
Real Estate
MLIFE
Accumulate
467
522
1,916
1,152
1,300
22.7
24.6
29.9
35.8
15.6
13.0
1.2
1.1
7.6
8.6
2.4
2.0
Prestige Estate
Neutral
243
-
9,120
4,707
5,105
25.2
26.0
10.3
13.0
23.6
18.7
1.9
1.8
10.3
10.2
3.1
2.8
Telecom
Bharti Airtel
Neutral
373
-
148,983
105,086
114,808
34.5
34.7
12.2
16.4
30.6
22.7
2.1
1.9
6.8
8.4
2.3
2.0
Idea Cellular
Neutral
91
-
32,651
40,133
43,731
37.2
37.1
6.4
6.5
14.2
13.9
1.2
1.1
8.2
7.6
1.8
1.6
zOthers
Abbott India
Neutral
4,220
-
8,967
3,153
3,583
14.1
14.4
152.2
182.7
27.7
23.1
136.1
116.3
25.6
26.1
2.6
2.2
Asian Granito
Neutral
387
-
1,164
1,060
1,169
12.2
12.5
12.7
15.9
30.6
24.4
2.9
2.6
9.5
10.7
1.4
1.2
Bajaj Electricals
Accumulate
351
395
3,557
4,801
5,351
5.7
6.2
10.4
13.7
33.7
25.7
4.2
3.7
12.4
14.5
0.7
0.7
Banco Products (India)
Neutral
233
-
1,663
1,353
1,471
12.3
12.4
14.5
16.3
16.0
14.3
22.2
20.0
14.5
14.6
1.2
125.8
Coffee Day Enterprises
Neutral
250
-
5,155
2,964
3,260
20.5
21.2
4.7
8.0
-
31.3
2.9
2.7
5.5
8.5
2.1
1.9
Ltd
Competent Automobiles Neutral
225
-
144
1,137
1,256
3.1
2.7
28.0
23.6
8.0
9.5
43.2
39.0
14.3
11.5
0.1
0.1
Stock Watch
May 11, 2017
Company Name
Reco
CMP
Target
Mkt Cap
Sales ( Čcr )
OPM(%)
EPS (Č)
PER(x)
P/BV(x)
RoE(%)
EV/Sales(x)
(Č)
Price ( Č)
( Č cr )
FY17E
FY18E
FY17E
FY18E
FY17E
FY18E
FY17E
FY18E
FY17E
FY18E
FY17E
FY18E
FY17E
FY18E
zOthers
Elecon Engineering
Neutral
63
-
709
1,482
1,660
13.7
14.5
3.9
5.8
16.2
10.9
3.8
3.5
7.8
10.9
0.8
0.7
Finolex Cables
Neutral
535
-
8,183
2,883
3,115
12.0
12.1
14.2
18.6
37.7
28.8
20.0
17.5
15.8
14.6
2.5
2.3
Garware Wall Ropes
Neutral
797
-
1,744
863
928
15.1
15.2
36.4
39.4
21.9
20.2
4.0
3.4
17.5
15.9
1.9
1.8
Goodyear India*
Neutral
846
-
1,951
1,598
1,704
10.4
10.2
49.4
52.6
17.1
16.1
79.0
69.3
18.2
17.0
0.9
128.6
Hitachi
Neutral
1,786
-
4,855
2,081
2,433
8.8
8.9
33.4
39.9
53.5
44.8
43.1
35.9
22.1
21.4
2.3
2.0
HSIL
Neutral
346
-
2,499
2,384
2,515
15.8
16.3
15.3
19.4
22.6
17.8
22.4
19.3
7.8
9.3
1.2
1.1
Interglobe Aviation
Neutral
1,124
-
40,625
21,122
26,005
14.5
27.6
110.7
132.1
10.2
8.5
60.8
43.4
168.5
201.1
1.9
1.5
Jyothy Laboratories
Neutral
378
-
6,860
1,440
2,052
11.5
13.0
8.5
10.0
44.4
37.8
10.8
10.0
18.6
19.3
5.0
3.5
Kirloskar Engines India
Neutral
400
-
5,782
2,554
2,800
9.9
10.0
10.5
12.1
38.1
33.1
15.9
15.0
10.7
11.7
1.9
1.7
Ltd
Linc Pen & Plastics
Neutral
290
-
429
382
420
9.3
9.5
13.5
15.7
21.6
18.5
3.7
3.2
17.1
17.3
1.2
1.1
M M Forgings
Neutral
637
-
769
546
608
20.4
20.7
41.3
48.7
15.5
13.1
87.3
77.3
16.6
17.0
1.3
1.1
Manpasand Bever.
Neutral
708
-
4,048
836
1,087
19.6
19.4
16.9
23.8
41.9
29.7
5.0
4.4
12.0
14.8
4.6
3.4
Mirza International
Neutral
132
-
1,587
963
1,069
17.2
18.0
6.1
7.5
21.5
17.6
3.3
2.8
15.0
15.7
1.9
1.7
MT Educare
Neutral
84
-
334
366
417
17.7
18.2
9.4
10.8
8.9
7.8
2.0
1.7
22.2
22.3
0.8
0.7
Narayana Hrudaya
Neutral
311
-
6,353
1,873
2,166
11.5
11.7
2.6
4.0
117.5
78.4
7.2
6.5
6.1
8.3
3.5
3.0
Navkar Corporation
Buy
215
265
3,066
369
561
42.9
42.3
6.9
11.5
31.1
18.7
2.2
2.0
7.4
10.5
9.3
6.1
Navneet Education
Neutral
165
-
3,848
1,062
1,147
24.0
24.0
6.1
6.6
27.1
24.9
5.6
4.9
20.6
19.8
3.7
3.4
Nilkamal
Neutral
2,218
-
3,309
1,995
2,165
10.7
10.4
69.8
80.6
31.8
27.5
126.7
110.1
16.6
16.5
1.7
1.5
Page Industries
Neutral
14,611
-
16,296
2,450
3,124
20.1
17.6
299.0
310.0
48.9
47.1
325.4
248.4
47.1
87.5
6.7
5.3
Parag Milk Foods
Neutral
250
-
2,100
1,919
2,231
9.3
9.6
9.5
12.9
26.4
19.3
4.1
3.4
15.5
17.5
1.2
1.1
Quick Heal
Neutral
243
-
1,700
408
495
27.3
27.0
7.7
8.8
31.3
27.6
2.9
2.9
9.3
10.6
3.3
2.7
Radico Khaitan
Buy
124
147
1,654
1,667
1,824
13.0
13.2
6.7
8.2
18.7
15.2
1.7
1.5
9.0
10.2
1.4
1.2
Relaxo Footwears
Neutral
492
-
5,909
2,085
2,469
9.2
8.2
7.6
8.0
65.1
61.9
25.2
21.5
17.9
18.8
2.9
2.5
S H Kelkar & Co.
Neutral
315
-
4,559
1,036
1,160
15.1
15.0
6.1
7.2
51.6
43.9
5.5
5.1
10.7
11.5
4.3
3.8
Siyaram Silk Mills
Accumulate
1,697
1,872
1,591
1,652
1,857
11.6
11.7
92.4
110.1
18.4
15.4
2.7
2.3
14.7
15.2
1.2
1.0
Styrolution ABS India*
Neutral
721
-
1,267
1,440
1,537
9.2
9.0
40.6
42.6
17.8
16.9
45.3
41.2
12.3
11.6
0.8
0.7
Surya Roshni
Neutral
285
-
1,248
3,342
3,625
7.8
7.5
17.3
19.8
16.5
14.4
31.3
25.1
10.5
10.8
0.6
0.6
Team Lease Serv.
Neutral
1,130
-
1,932
3,229
4,001
1.5
1.8
22.8
32.8
49.6
34.4
5.3
4.6
10.7
13.4
0.5
0.4
The Byke Hospitality
Neutral
211
-
847
287
384
20.5
20.5
7.6
10.7
27.8
19.7
5.8
4.7
20.7
23.5
3.0
2.2
Stock Watch
May 11, 2017
Company Name
Reco
CMP
Target Mkt Cap
Sales ( Čcr )
OPM(%)
EPS (Č)
PER(x)
P/BV(x)
RoE(%)
EV/Sales(x)
(Č)
Price ( Č)
( Č cr )
FY17E FY18E FY17E FY18E FY17E FY18E FY17E FY18E FY17E FY18E FY17E FY18E FY17E FY18E
zOthers
Transport Corporation of
Neutral
251
-
1,921
2,671
2,911
8.5
8.8
13.9
15.7
18.1
16.0
2.5
2.2
13.7
13.8
0.8
0.8
India
TVS Srichakra
Neutral
4,042
-
3,095
2,304
2,614
13.7
13.8
231.1
266.6
17.5
15.2
454.2
357.6
33.9
29.3
1.3
1.2
UFO Moviez
Neutral
440
-
1,214
619
685
33.2
33.4
30.0
34.9
14.7
12.6
2.0
1.8
13.8
13.9
1.7
1.3
Visaka Industries
Neutral
348
-
553
1,051
1,138
10.3
10.4
21.0
23.1
16.6
15.0
44.6
41.8
9.0
9.2
0.8
0.7
VRL Logistics
Neutral
327
-
2,981
1,902
2,119
16.7
16.6
14.6
16.8
22.4
19.4
4.9
4.3
21.9
22.2
1.7
1.5
Wonderla Holidays
Neutral
385
-
2,174
287
355
38.0
40.0
11.3
14.2
34.0
27.1
4.9
4.3
21.4
23.9
7.3
5.9
VIP Industries
Accumulate
197
218
2,782
1,270
1,450
10.4
10.4
5.6
6.5
35.2
30.3
7.3
6.4
20.7
21.1
2.2
1.9
Navin Fluorine
Buy
3,056
3,650
2,992
789
945
21.1
22.4
120.1
143.4
25.4
21.3
4.1
3.5
17.8
18.5
3.7
3.0
Source: Company, Angel Research; Note: *December year end; #September year end; &October year end; Price as on May 10, 2017
Market Outlook
May 11, 2017
Research Team Tel: 022 - 39357800
DISCLAIMER
Angel Broking Private Limited (hereinafter referred to as “Angel”) is a registered Member of National Stock Exchange of India
Limited,Bombay Stock Exchange Limited and Metropolitan Stock Exchange Limited. It is also registered as a Depository Participant with
CDSL and Portfolio Manager with SEBI. It also has registration with AMFI as a Mutual Fund Distributor. Angel Broking Private Limited is a
registered entity with SEBI for Research Analyst in terms of SEBI (Research Analyst) Regulations, 2014 vide registration number
INH000000164. Angel or its associates has not been debarred/ suspended by SEBI or any other regulatory authority for accessing
/dealing in securities Market. Angel or its associates/analyst has not received any compensation / managed or
co-managed public offering of securities of the company covered by Analyst during the past twelve months.
This document is solely for the personal information of the recipient, and must not be singularly used as the basis of any investment
decision. Nothing in this document should be construed as investment or financial advice. Each recipient of this document should make
such investigations as they deem necessary to arrive at an independent evaluation of an investment in the securities of the companies
referred to in this document (including the merits and risks involved), and should consult their own advisors to determine the merits and
risks of such an investment.
Reports based on technical and derivative analysis center on studying charts of a stock's price movement, outstanding positions and
trading volume, as opposed to focusing on a company's fundamentals and, as such, may not match with a report on a company's
fundamentals. Investors are advised to refer the Fundamental and Technical Research Reports available on our website to evaluate the
contrary view, if any.
The information in this document has been printed on the basis of publicly available information, internal data and other reliable
sources believed to be true, but we do not represent that it is accurate or complete and it should not be relied on as such, as this
document is for general guidance only. Angel Broking Pvt. Limited or any of its affiliates/ group companies shall not be in any way
responsible for any loss or damage that may arise to any person from any inadvertent error in the information contained in this report.
Angel Broking Pvt. Limited has not independently verified all the information contained within this document. Accordingly, we cannot
testify, nor make any representation or warranty, express or implied, to the accuracy, contents or data contained within this document.
While Angel Broking Pvt. Limited endeavors to update on a reasonable basis the information discussed in this material, there may be
regulatory, compliance, or other reasons that prevent us from doing so.
This document is being supplied to you solely for your information, and its contents, information or data may not be reproduced,
redistributed or passed on, directly or indirectly.
Neither Angel Broking Pvt. Limited, nor its directors, employees or affiliates shall be liable for any loss or damage that may arise from
or in connection with the use of this information.